Economic momentum across Australia’s states and territories shook off some tough conditions in the first quarter of calendar 2022, the ANZ Stateometer found, thanks largely to a sharp increase in trade as Australia’s borders reopened.
The ongoing COVID-19 pandemic, the crisis in Ukraine and flooding on the east coast all threatened to impact momentum, but Australia entered the June quarter on a solid footing amid resilience in consumer demand and continued strength in the labour market.
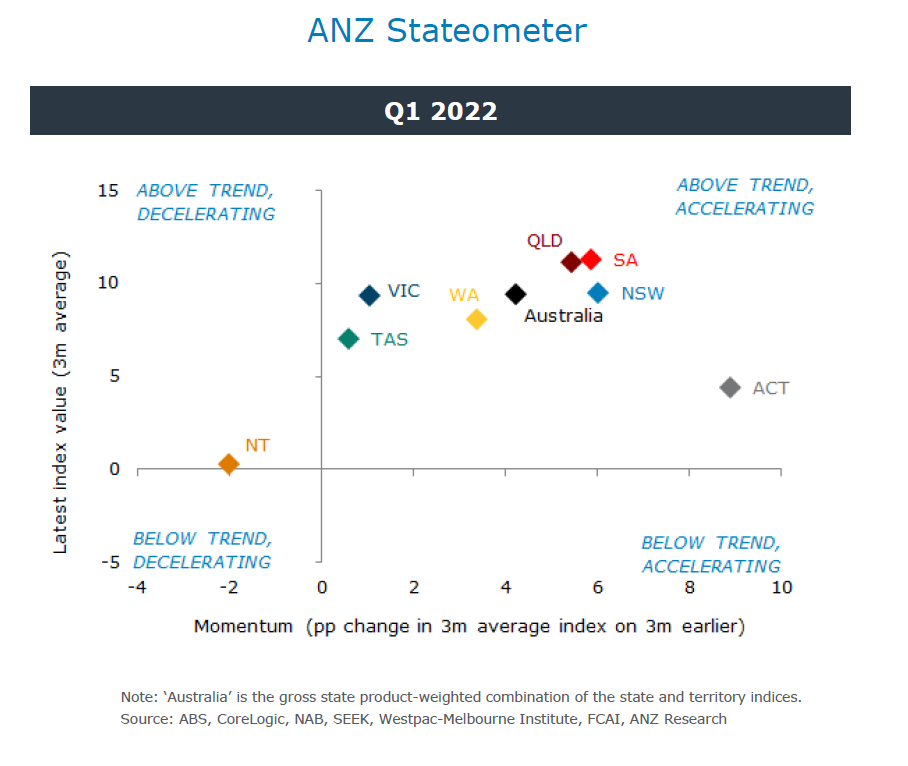
According to the ANZ Stateometer, economic performance in all Australian states and territories remained above trend in the three months to the end of March. Momentum accelerated across all states and territories other than the Northern Territory.
New South Wales and Queensland were among the top performers in the period, reflecting strong trade momentum for both states as borders reopened. This also benefited Victoria.
South Australia and Western Australia saw above-trend performance with merchandise trade a bright spot for growth.
ANZ Senior Economists Catherine Birch and Adelaide Timbrell talk through the results of the latest ANZ Stateometer.
Economic momentum across Australia’s states and territories shook off some tough conditions in the first quarter of calendar 2022, the Stateometer found.
A sharp increase in trade as Australia’s borders reopened was the major driver.
You can read more in the body copy.
Issue
Like most of the world, inflation is becoming an issue across Australia’s states and territories. Households and businesses are feeling the pressure, and real wages are falling.
In 2022, ANZ Research expects wages growth to accelerate on a nominal basis; in real terms, wages will continue to fall for some time.
There are, however, airbags in place for inflation and rate impacts, with the Reserve Bank of Australia expected to deliver around 200 basis points of cash rate hikes by the middle of 2023. On an aggregate basis, households are well placed to absorb those hikes, given higher savings levels and the strong employment and wages outlook.
The graphic shows all of Australia's states and territories in the top-right quartile, labelled ‘above trend, accelerating’, except for the Northern Territory, which is in the top-left quartile, labelled ‘above trend, decelerating’.
Robust
The ANZ Stateometer showed a rise in NSW’s economic momentum in the first quarter, with the index slightly above the rest of Australia. Victoria’s economic activity was robust, with an increase in trade partially offset by lower business, housing and labour components.
In Queensland, economic momentum accelerated in the first quarter, with all five components above trend, despite widespread flooding during the period.
SA’s economy remained robust, with the index higher than the national average. The labour component rose, even in the face of the highest unemployment rate of all states.
WA’s economic performance improved, with labour and trade the major drivers. Tasmania’s performance accelerated slightly, while NT’s momentum fell to a level slightly above neutral. The ACT saw a sharp rise in performance.
The ANZ Stateometer is a set of composite indices that measure economic performance across Australia’s states and territories.
For each jurisdiction, the index extracts the common trend across multiple indicators (between 24 and 32, depending on data available in the jurisdiction). The economic indicators are monthly data series and cover the consumer, business, housing, labour and trade sectors.
The indices can be thought of as measuring annual growth in economic performance, given we calculated the common trend across annual growth in the underlying indicators. This means that an increase in the index equates to faster growth, while a decrease in the index equates to slower growth.
Each index is expressed as a deviation from its long-run average. This means that a positive reading indicates economic performance is above trend, while a negative reading indicates that performance is below trend.
We smooth each index by reporting the three-month average of each series.
The ANZ Stateometer is correlated with broader measures of economic activity, like state final demand, but wasn’t designed to forecast these series.
Bansi Madhavani, Catherine Birch & Adelaide Timbrell are Senior Economists, and Arindam Chakraborty is a Junior Economist at ANZ
This publication is published by Australia and New Zealand Banking Group Limited ABN 11 005 357 522 (“ANZBGL”) in Australia. This publication is intended as thought-leadership material. It is not published with the intention of providing any direct or indirect recommendations relating to any financial product, asset class or trading strategy. The information in this publication is not intended to influence any person to make a decision in relation to a financial product or class of financial products. It is general in nature and does not take account of the circumstances of any individual or class of individuals. Nothing in this publication constitutes a recommendation, solicitation or offer by ANZBGL or its branches or subsidiaries (collectively “ANZ”) to you to acquire a product or service, or an offer by ANZ to provide you with other products or services. All information contained in this publication is based on information available at the time of publication. While this publication has been prepared in good faith, no representation, warranty, assurance or undertaking is or will be made, and no responsibility or liability is or will be accepted by ANZ in relation to the accuracy or completeness of this publication or the use of information contained in this publication. ANZ does not provide any financial, investment, legal or taxation advice in connection with this publication.